 Learn more ...
 Learn more ...
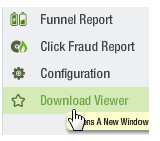
1. In the side navigation bar, click Web Analytics then Download Viewer.

2. In the dialog that appears, click Run to install the program.
After installation, you can choose to open the Viewer immediately in a separate window.
Creating and analyzing segments is one of the most important techniques you can use to learn how visitors use your site. You can think of a segment as a group of visitors who performed a particular action. Here are just some of the segments you can create:
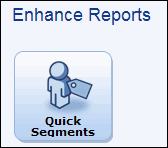
1. In the Viewer, click the Quick Segments button.

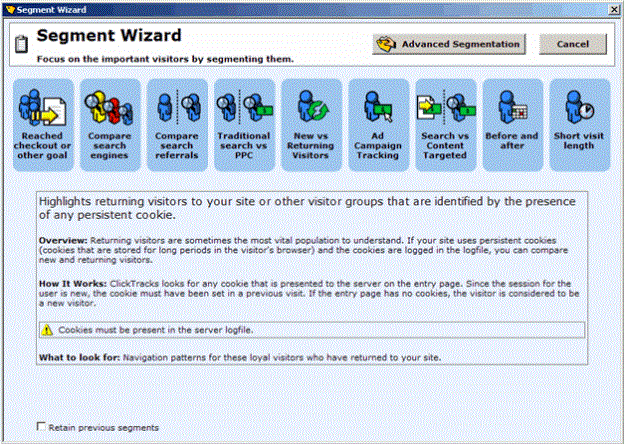
The Segment Wizard opens in a new window.

2. The nine buttons represent different types of segments. Move the pointer over each of the buttons to see a description and detailed notes about the section.
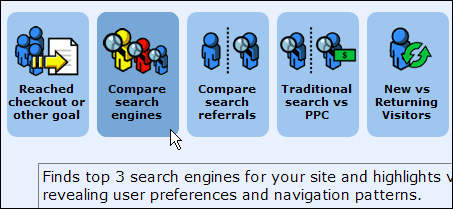
3. Click the Compare search engines button.

3.Click the Go button.
From this point on, your reports will show which of the top three search engines visitors came from by diving them into color-coded segments.

For guidance in configuring the Funnel Report, creating visitor segments and establishing KPIs, contact your Account Manager to arrange a Professional Services engagement.